One city, known street by street.
Riders follow real delivery demand, so coverage is something we measure. This is where the fleet actually goes: by zone, by hour, and through all three of Norwich's rush hours.
Born in Norwich.
Every screen CurbCast owns is on a moped in Norwich, carried by someone who was already making that trip. That is why the footfall behind our estimates is real footfall.
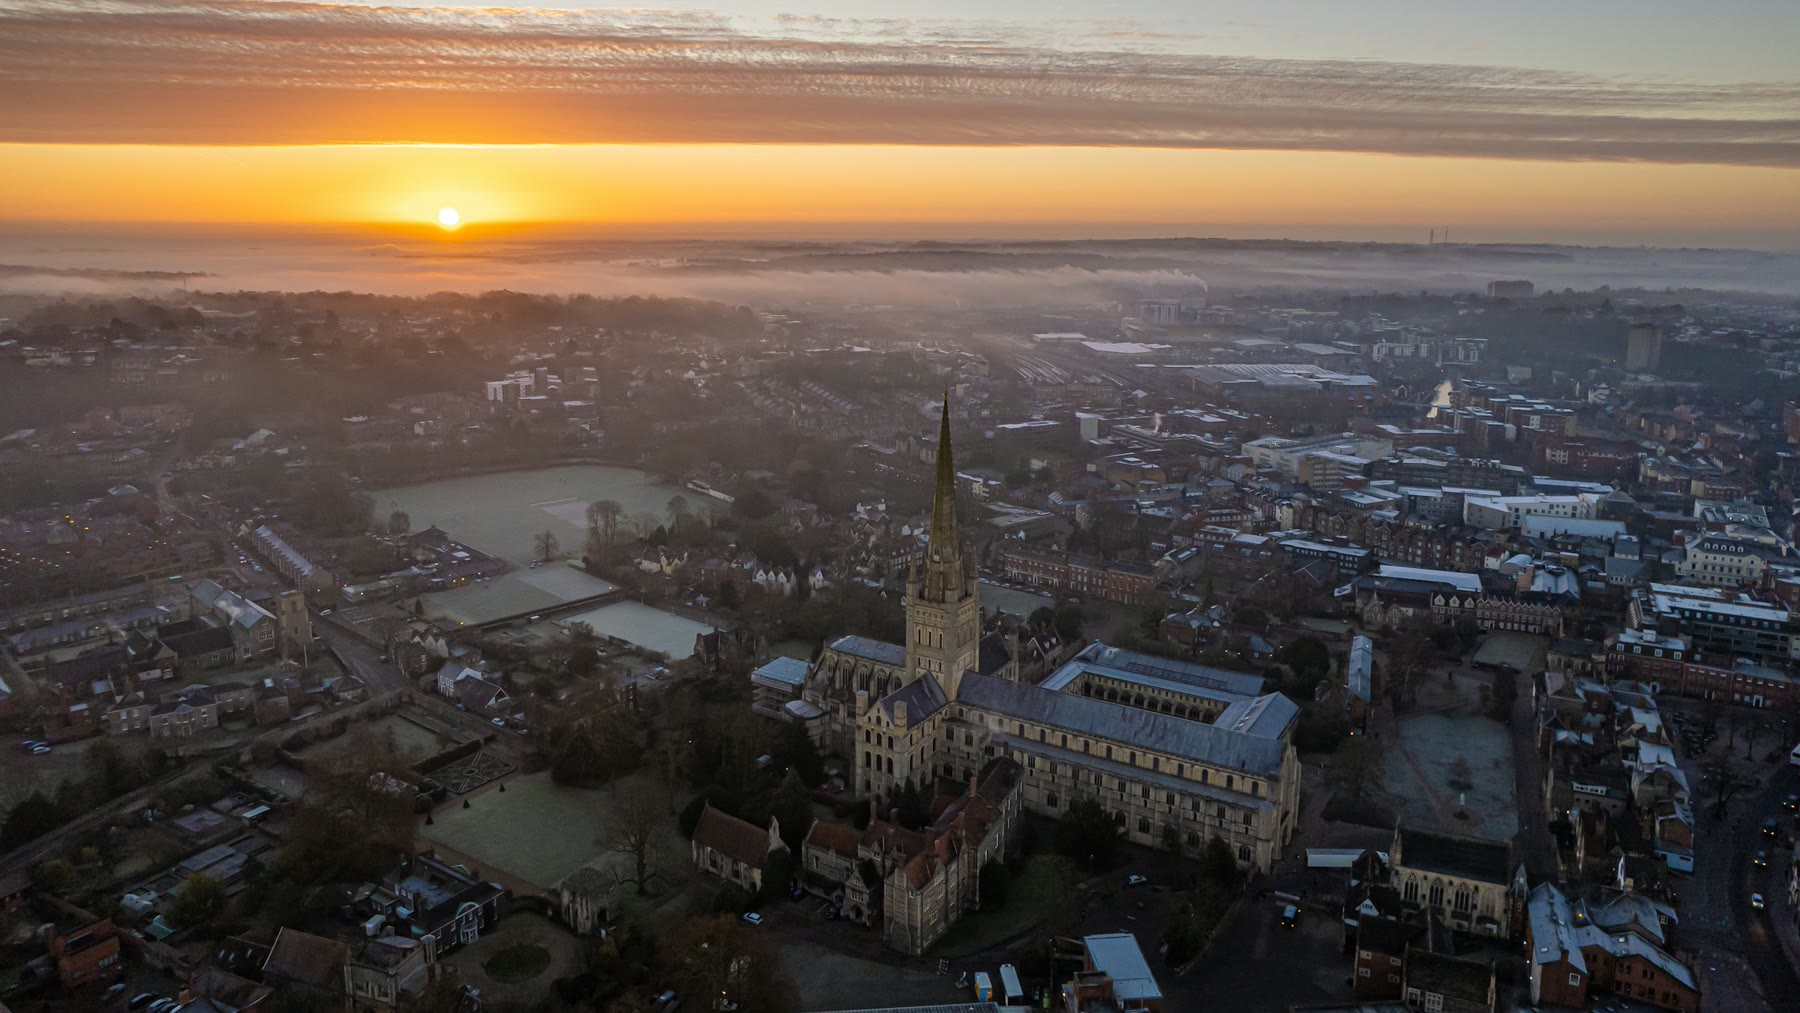
All our riders, one city. There is nowhere else a CurbCast screen is switched on.
Aerial photograph of Norwich by Harry Borrett, Unsplash Licence. Location verified against the cathedral.
Right now your advert could be riding through Gentleman’s Walk
2,500 people an hour at peak
CurbCast riders cover 21 Norwich zones, including Gentleman’s Walk, The Lanes, Castle Quarter, Chantry Place, St Stephens, London Street, Riverside, Tombland, UEA, St Benedicts Street. Peak hourly footfall figures are derived from Norwich BID and DfT road traffic data.
Norwich has three rush hours.
Every one of the twenty-one zones we model peaks at midday, at five, or at seven — and there is no fourth. Seven peak at midday: the retail core, and the university. Eleven peak at five, out in the suburbs. Three peak at seven: Riverside, Tombland, St Benedicts. A billboard has to pick one of those hours. A screen on a moped rides all three.
Right now · 4pm
Play the day879
people an hour past Gentleman’s Walk
The busiest of the 8 zones on the map. Tap a section to read another.
Footfall modelled from Norwich BID, State of the City 2025 — hour and month curves. Vehicle occupants and cyclists come from DfT road traffic statistics (Norfolk 2025, Open Government Licence) at DfT National Travel Survey occupancy, so each figure is the TOTAL reachable audience rather than pedestrians alone. The day-of-week shape is the Springboard UK high-streets index, a national heuristic rather than a Norwich count, which is why “busiest hour” names a Saturday on our model rather than on BID’s. Street and building geometry © OpenStreetMap contributors.
At 16:00 on MON 2 NOV, CurbCast’s model estimates the following people per hour, on foot, in vehicles and on bikes, across the twenty-one Norwich zones it covers: Trowse 1235, Magdalen Street 1131, Anglia Square 955, Gentleman’s Walk · Norwich Market 879, The Lanes 868, Golden Triangle 803, Castle Quarter 796, Chantry Place · Westlegate 700, Sprowston 663, UEA · University Plain 641, St Stephens 630, Thorpe Hamlet 567, Costessey 561, Eaton 531, Cringleford 528, London Street 465, Riverside 459, Tombland · Cathedral Quarter 449, Thorpe St Andrew 437, St Benedicts Street 419, Catton 269. All figures are model estimates calibrated against Norwich BID State of the City 2025 (pedestrians) and DfT road traffic statistics, Norfolk 2025 (vehicles and cyclists).